Another month of trading has ended and it's time for us to take stock. Both high dynamics and a stable sideways trend were combined in August, where it was not boring. For a long time, the quote was concentrated within the price values of 1.1700 // 1.1810 // 1.1900, trying to break out of them every now and then, signaling that speculative excitement prevails in the market. The upward spiral set at the end of the last week put an end to the question of the market direction. The local high of 1.1965 on August 18 still fell under the speculators' attack, and the market updated the high of 2020 again.
Will we be able to fundamentally work out the mid-term downward trend of 2018? Of course. Considering the achievements of the European currency, only 26% (570 points) remained until a full recovery, but even with such a stable direction, many traders adhere to local positions rather than trend ones. The reason lies in the high emotional mood of the market, where everything can change quickly.
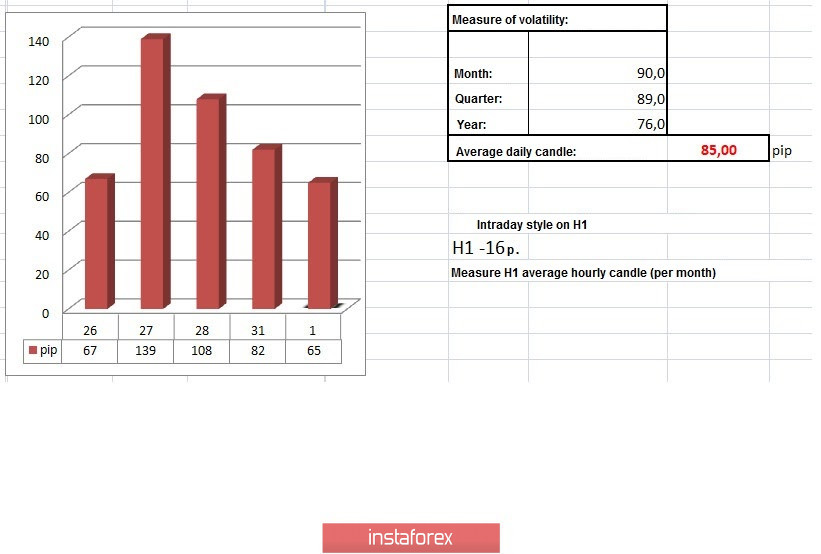
In terms of daily dynamics, an indicator is recorded that is almost equal to the average level, which indicates stable activity in the market.
Analyzing the dynamics of volatility in August, you can see that the average daily indicator is 90 points, which is 5.8% higher than the average. In comparison with July, there is an acceleration of volatility by 2.2%.
August : Monday - 100 points; Tuesday - 84 points; Wednesday - 111 points; Thursday - 97 points; Friday - 128 points; Monday - 66 points; Tuesday - 85 points; Wednesday - 104 points; Thursday - 83 points; Friday - 68 points; Monday - 51 points; Tuesday - 100 points; Wednesday - 122 points; Thursday - 66 points; Friday - 128 points; Monday - 65 points; Tuesday - 59 points; Wednesday - 67 points; Thursday - 139 points; Friday - 108 points; Monday - 82 points.
The dynamics since the beginning of the year is 89 points (average daily value), which confirms the presence of speculators in the market once again.
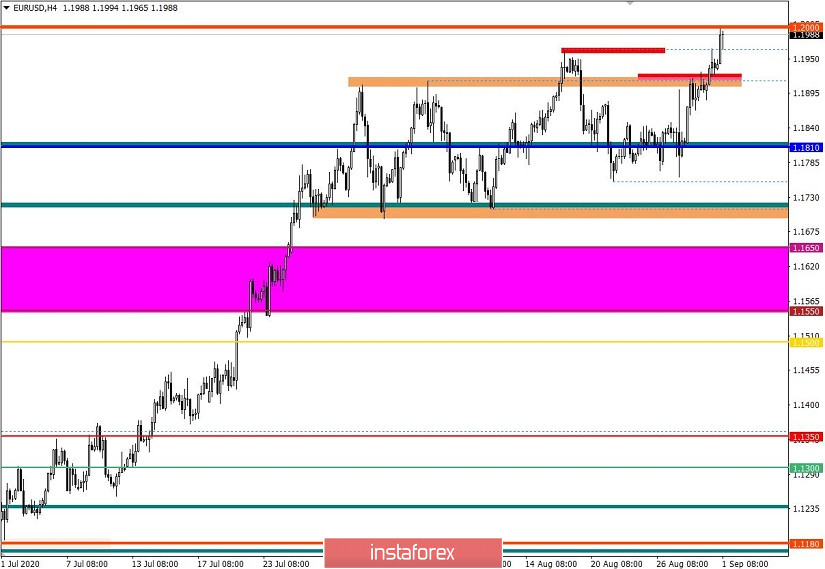
Considering the trading chart in general terms (daily period), it can be seen that the quote has gone beyond the flat boundaries and is at the levels of the spring of 2018.
The news background of the past day contained preliminary data on inflation in Germany, where forecasts for the rate of decline at the level of -0.1% were confirmed in the market.
The main impulse for the upward movement was the speculative background due to the speech of the Fed's Vice Chairman, Richard Clarida, who raised the topic of negative rates in a very unclear manner. There are no specifics, as always, but theoretically, the Fed may consider a negative rate instrument in the near future.
In terms of the economic calendar, today's main news is Europe's inflation, where a decline is expected from 0.4% to 0.2% - 0.0% according to forecasts.
Tuesday , September 1
EU 9:00 Universal time - Unemployment rate for July
EU 9:00 Universal time - Inflation, PRELIMINARY
USA 14:00 Universal time - ISM Manufacturing PMI, August
Further development
Analyzing the current trading chart, you can see that there was an active upward price movement during the Asian session, which brought the quote to the psychological level of 1.2000.
Naturally, this level will slow down market participants, which led to a local pullback.
To resume the upward move, the quote must consolidate above 1.2020/1.2030. In this case, buyers will have a chance to move towards 1.2080-1.2100.
An alternative scenario: Consider a transition from the pullback stage to a correction, in which price consolidation below 1.1950 may return us to the level of 1.1900.
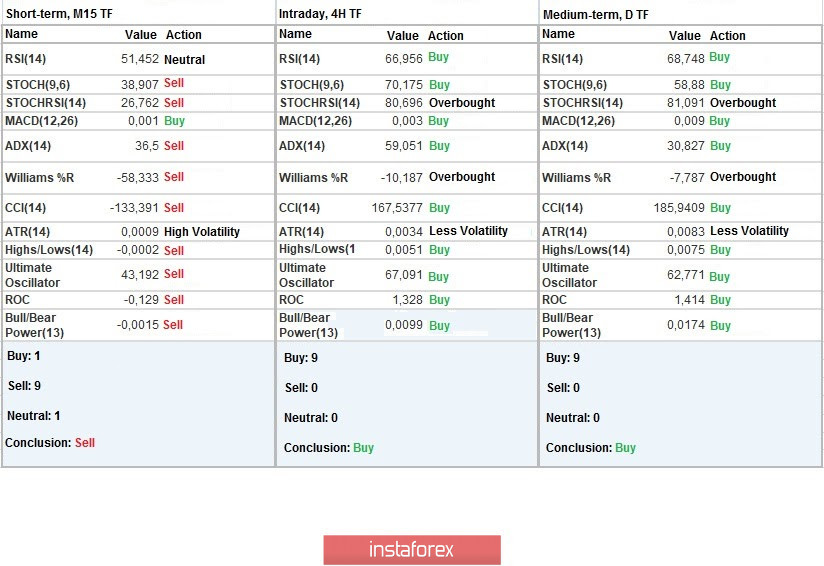
Indicator analysis
Analyzing different sectors of time frames (TF), we see that the indicators of technical instruments on minute intervals signal a sell due to a pullback. On the other hand, hourly and daily periods signal a buy by updating the highs.
Weekly volatility/Volatility measurement: Month; Quarter; Year
The volatility measurement reflects the average daily fluctuations, calculated per Month/Quarter/Year.
(It was built considering the publication time of the article)
The volatility of the current time is 65 points, which is considered a high indicator for the start of the European session. We can assume that against the existing speculative background, we can still see an acceleration in the market.
Key levels
Resistance zones: 1.2000 ***; 1.2100 *; 1.2450 **; 1.2550; 1.2825.
Support zones: 1.1910 **; 1.1800; 1.1650 *; 1.1500; 1.1350; 1.1250 *; 1.1180 **; 1.1080; 1.1000 ***.
* Periodic level
** Range level
*** Psychological level