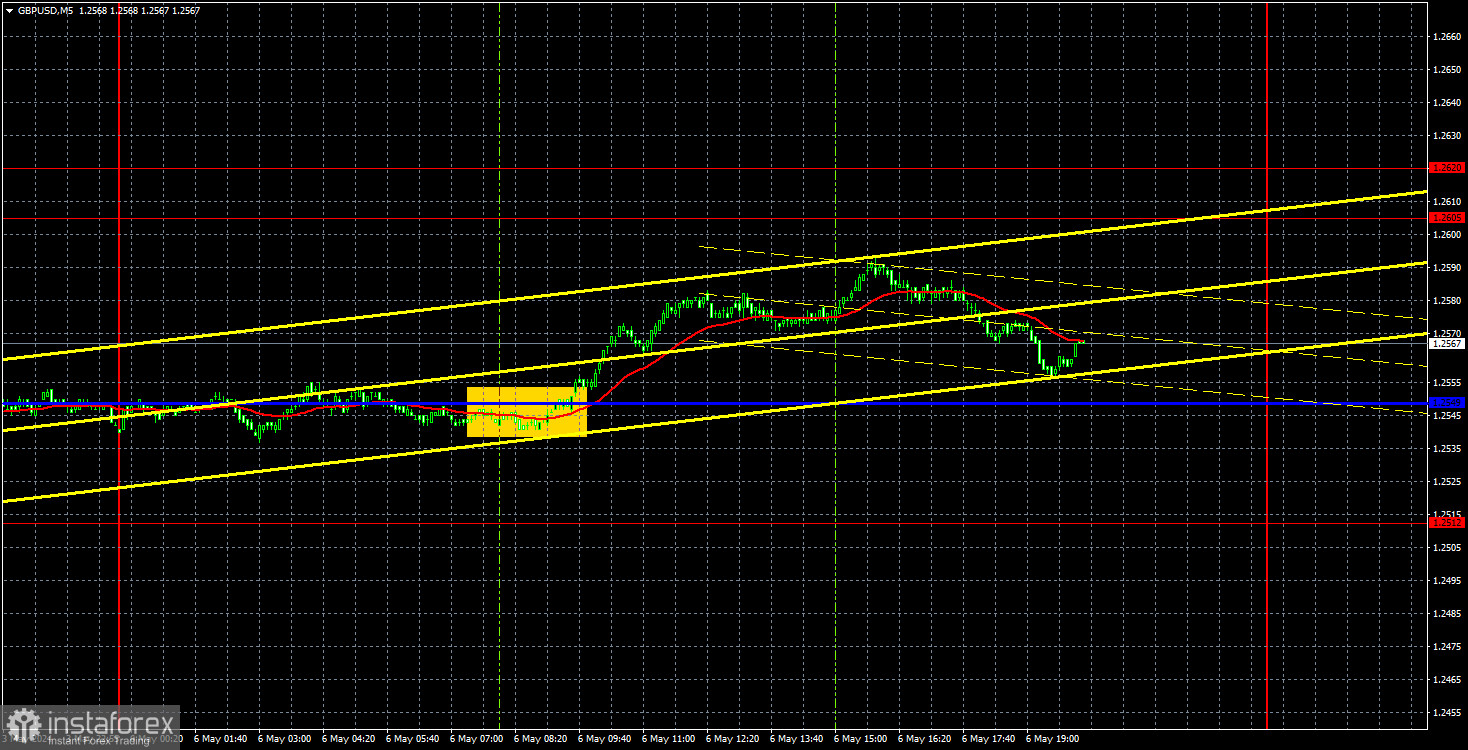
Analysis of GBP/USD 5M
GBP/USD also tried to continue its upward movement on Monday. Despite leaving the ascending channel last week, the upward movement persists. The British pound is once again rising for no apparent reason. If the market had valid reasons to sell the dollar last week and the week before that, it had none yesterday. Moreover, the market often "ignores" factors that should lead to a decline in the British pound, but it doesn't miss any factors for selling the dollar. Overall, we still believe that the pound exhibits illogical movements. Furthermore, it is too expensive, and overbought.
There were no macroeconomic or fundamental events in either the United States or the United Kingdom. There was nothing for traders to react to during the day. From a technical perspective, the uptrend persists in the short-term — the price is above the Ichimoku indicator lines. We can determine its end once the price closes below the Senkou Span B line. However, the Bank of England meeting will take place this week, and the market may interpret its results in favor of the pound, even if in reality, it doesn't. Caution is advised.
Only one trading signal was formed on Monday. At the very beginning of the European trading session, the price settled above the critical line, which is considered a buy signal. At its peak, the pair was up by about 30 pips but it failed to reach the nearest target level of 1.2605. In the afternoon, it almost returned to the Kijun-sen line. It was difficult to make profit from this trade since volatility was low on Monday. However, the signal itself was strong and accurate.
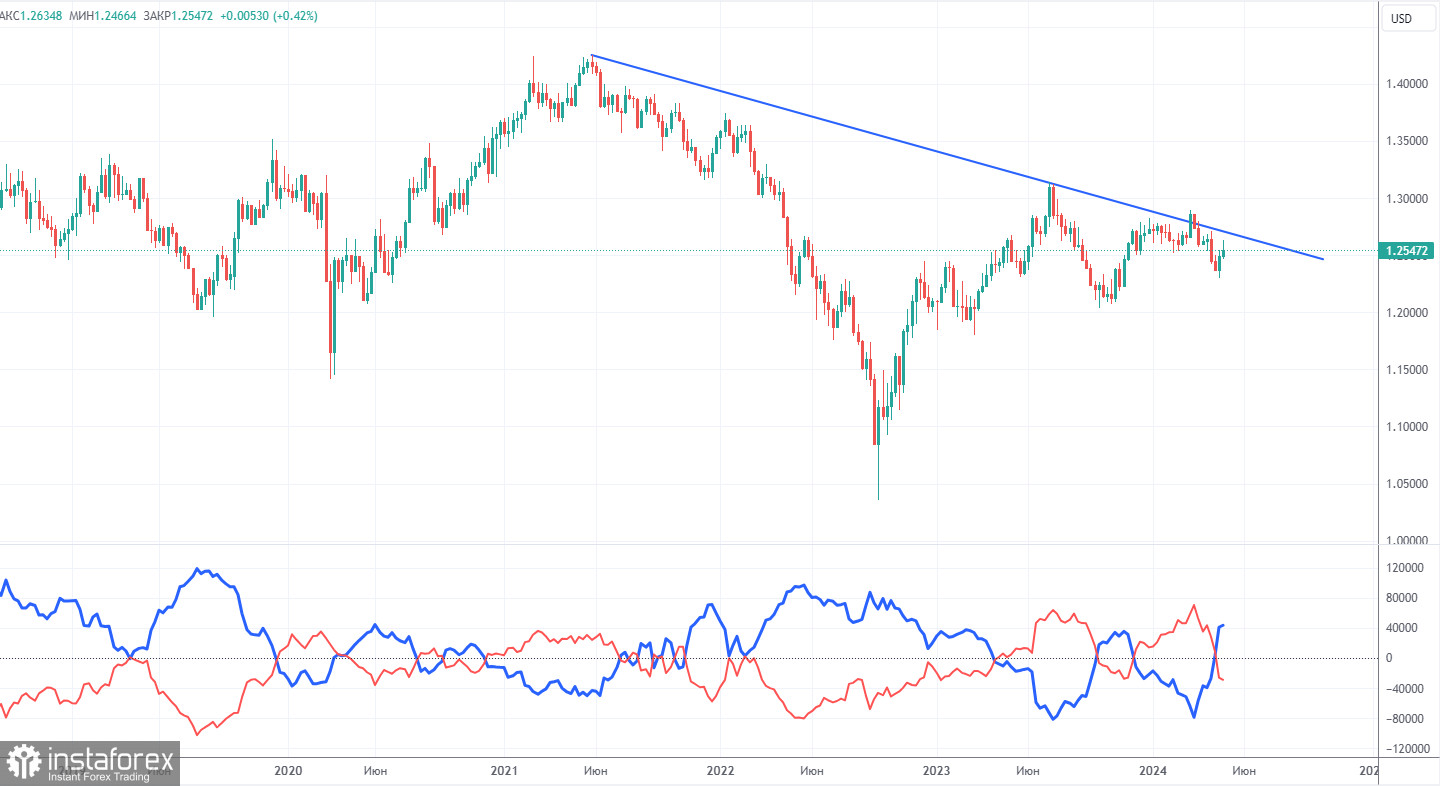
COT report:
COT reports on the British pound show that the sentiment of commercial traders often changes in recent years. The red and blue lines, which represent the net positions of commercial and non-commercial traders, constantly intersect and, in most cases, remain close to the zero mark. According to the latest report on the British pound, the non-commercial group closed 4,800 buy contracts and 2,000 short ones. As a result, the net position of non-commercial traders decreased by another 2,800 contracts in a week. Sellers continue to hold their ground. The fundamental background still does not provide a basis for long-term purchases of the pound sterling, and the currency finally has a real chance to resume the global downward trend. The trend line on the 24-hour TF clearly shows this. Almost all of the factors point to the pound's decline.
The non-commercial group currently has a total of 43,700 buy contracts and 72,700 sell contracts. Now the bears are in control and the pound has a huge potential to fall. We can only hope that inflation in the UK does not accelerate, or that the Bank of England will not intervene.
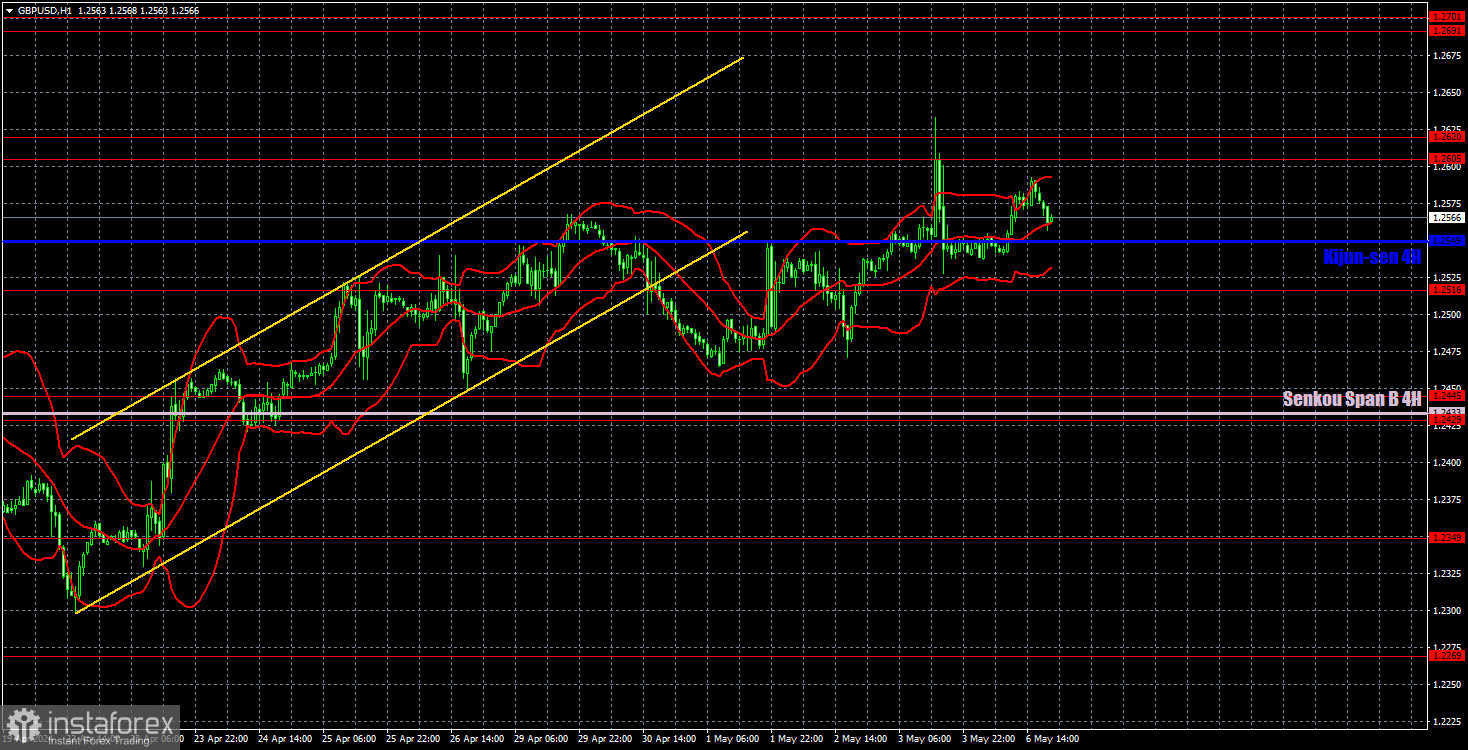
Analysis of GBP/USD 1H
On the 1H chart, GBP/USD continues to go through a bullish correction, which could turn into anything. It could be the start of a new uptrend. It could bring back the sideways movement. Perhaps we are currently witnessing a strong correction, afterwards the pound could fall. The problem lies in the fact that the pound moves in an illogical manner. Therefore, it is extremely difficult to predict its movements.
As of May 7, we highlight the following important levels: 1.2215, 1.2269, 1.2349, 1.2429-1.2445, 1.2516, 1.2605-1.2620, 1.2691-1.2701, 1.2786, 1.2863, 1.2981-1.2987. The Senkou Span B line (1.2433) and the Kijun-sen line (1.2549) lines can also serve as sources of signals. Don't forget to set a Stop Loss to breakeven if the price has moved in the intended direction by 20 pips. The Ichimoku indicator lines may move during the day, so this should be taken into account when determining trading signals.
On Tuesday, there are no important events scheduled in the UK and the US. Traders will have nothing to react to, and volatility may be very weak once again. It's unlikely that the market will find grounds to end the correction, but the results of the Bank of England meeting will be announced on Thursday, so the market may start anticipating them in advance.
Description of the chart:
Support and resistance levels are thick red lines near which the trend may end. They do not provide trading signals;
The Kijun-sen and Senkou Span B lines are the lines of the Ichimoku indicator, plotted to the 1H timeframe from the 4H one. They provide trading signals;
Extreme levels are thin red lines from which the price bounced earlier. They provide trading signals;
Yellow lines are trend lines, trend channels, and any other technical patterns;
Indicator 1 on the COT charts is the net position size for each category of traders;