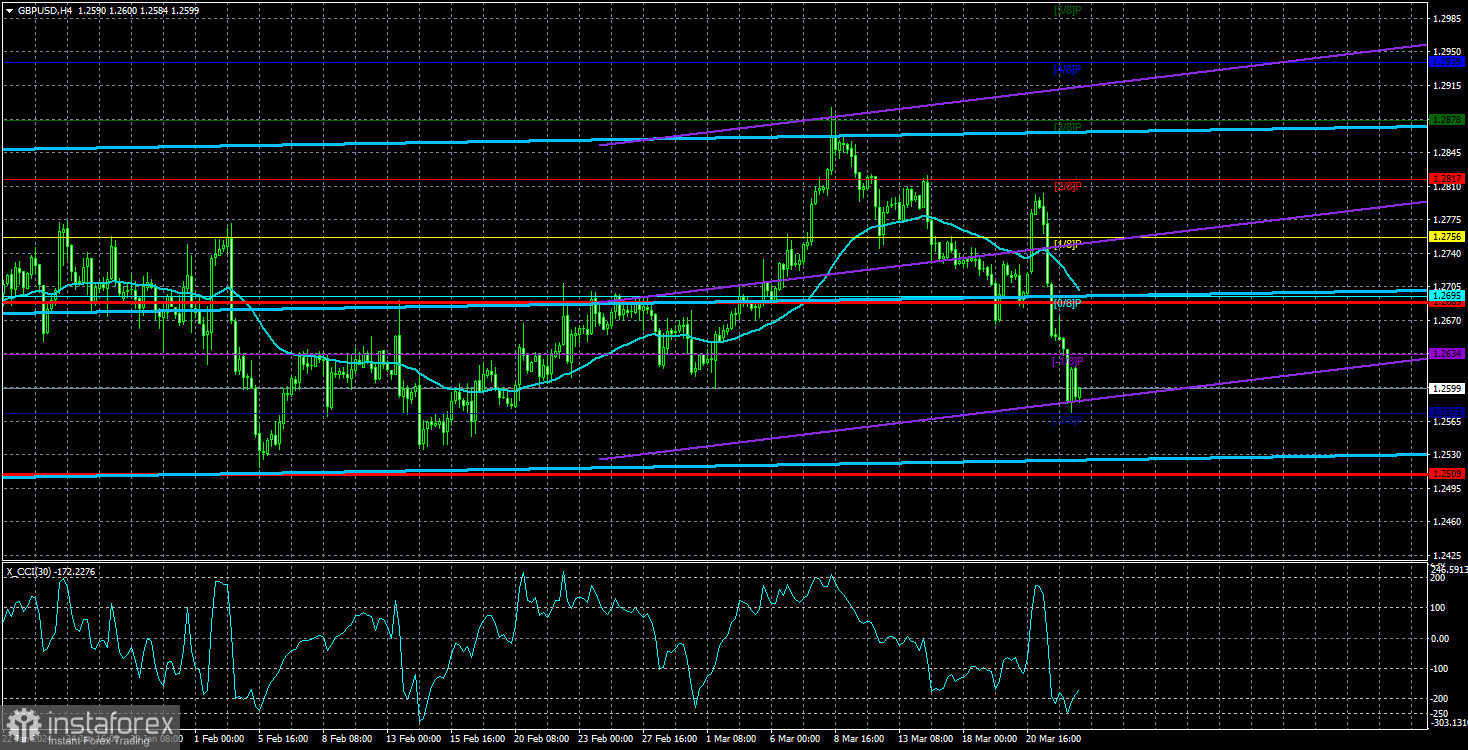
The GBP/USD currency pair continued its downward movement on Friday. On Wednesday evening, after the Fed meeting, the US dollar sharply retreated, which was a logical market reaction. We warned that the initial market reaction to the Fed meeting is rarely logical and justified. Thursday and Friday showed us that the market correctly interpreted the results of the FOMC meeting, which triggered the dollar's rise. However, even after the British currency fell by 300 points, one should be cautious with conclusions. Analyzing the 4-hour TF, we constantly alternate between trends. But as soon as we switch to the daily chart, it immediately becomes clear - we are still potentially in a flat. In recent weeks, it has already become much less like a flat than it did a couple of months ago; that's a fact. But still, the price remains in the same price range as before.
As before, we expect only declines in the British currency. Unfortunately, in most cases, the market has refused to sell the pound over the past 3-4 months. Therefore, even the current drop of 300 points does not guarantee its continuation in the future. Remember that the Bank of England has already started signaling impending monetary policy easing, which caused the pound's decline last week. However, the fact that a rate cut will start in the UK in 2024 was clear several months ago. The British regulator remains in a much more difficult position than the Fed. The economy contracted by 0.3% in the fourth quarter after a 0.1% decline in the third. The first quarter of 2024 may also be negative. And all together, this is called a recession.
Additionally, inflation in the UK has been truly decreasing lately, unlike in the US. So, here's the picture. Inflation is falling and is already approaching 3%, below which serious consideration of rate cuts may begin. At the same time, the economy is contracting and needs to be saved. And for this, monetary policy easing is also required. Thus, the Bank of England is even closer to a rate cut than the Fed. This factor is sufficient for the pound to continue its decline. But what do market makers think, who have also had enough reasons to sell in recent months?
There will be very few fundamental and macroeconomic events this week. Jerome Powell's Friday speech and "hawkish" words can greatly help the dollar rise. The further the rhetoric of the Fed head moves away from the phrase "easing in June," the stronger the support for the dollar will be. Also, reports on GDP for the fourth quarter and durable goods orders will be published in the US. In the UK, however, there will be only one publication this week - GDP for the fourth quarter in the final assessment. There will be very few important events, which again may negatively affect the overall volatility of the pair and its movement characteristics.
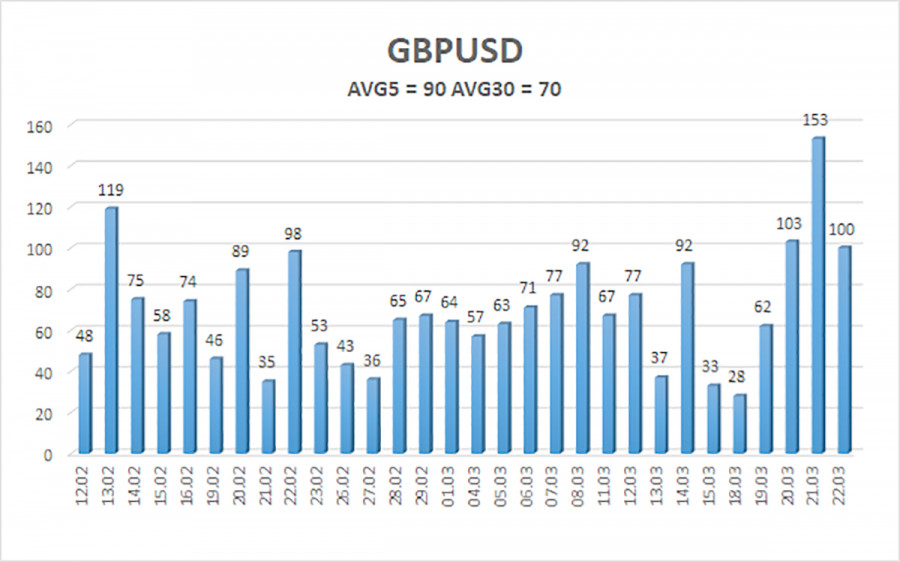
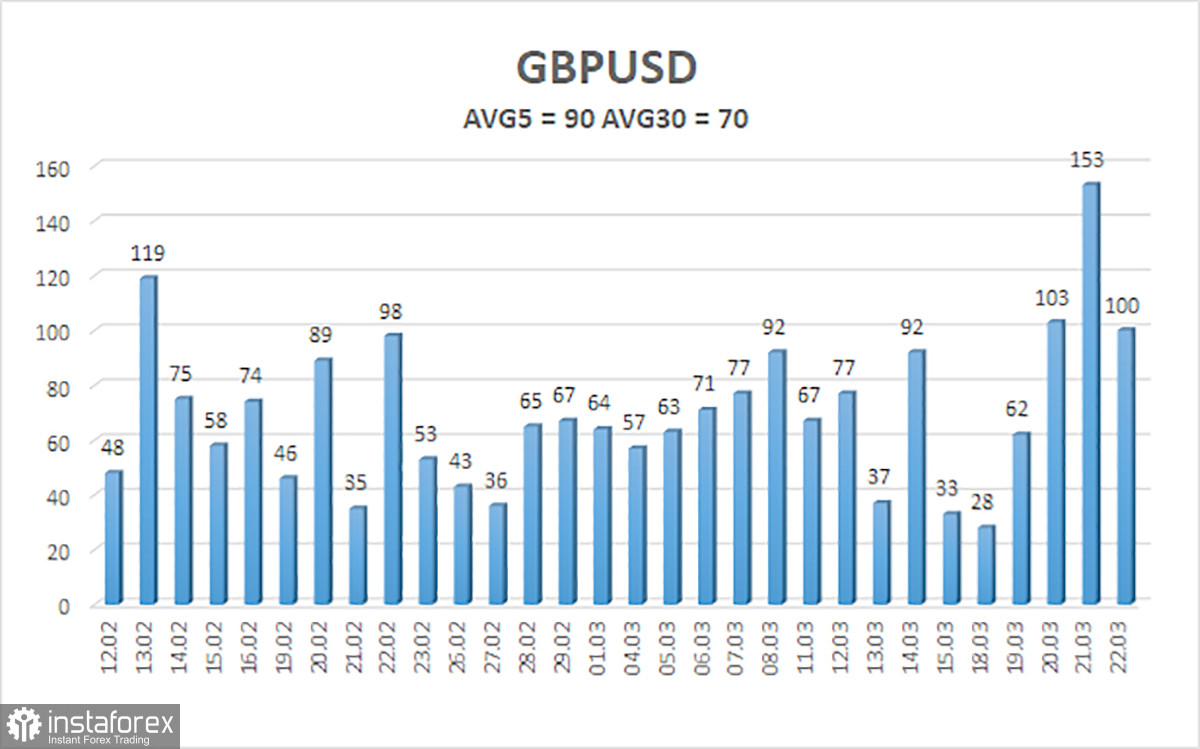
The average volatility of the GBP/USD pair for the last 5 trading days is 90 pips. For the pound/dollar pair, this value is considered "average." Therefore, on Monday, March 25, we expect movement within the range limited by the levels of 1.2509 and 1.2689. The senior linear regression channel is still sideways, so there are no questions about the current trend. The CCI indicator has not entered the oversold zone lately, nor has it entered the overbought zone. The market needs to be more logical, but traders can expect a new significant downward movement.
Nearest support levels:
S1 - 1.2573
Nearest resistance levels:
R1 - 1.2634
R2 - 1.2695
R3 - 1.2756
Trading recommendations:
The GBP/USD currency pair has formed a new downward movement wave. We still expect movement to the South with targets at 1.2543 and 1.2512. The market still reluctantly buys the dollar and sells the pound, often ignoring the fundamental and macroeconomic background. Long positions can be considered when the price is above the moving average. Still, such a direction of movement may be caused only by the actions of market makers rather than by common sense and logic.
Explanations for the illustrations:
Linear regression channels - help determine the current trend. If both are directed in the same direction, the trend is strong.
The moving average line (settings 20.0, smoothed) - determines the short-term trend and the direction in which trading should be conducted now.
Murray levels - target levels for movements and corrections.
Volatility levels (red lines) - the likely price channel the pair will spend the next day, based on current volatility indicators.
CCI indicator - its entry into the oversold zone (below -250) or the overbought zone (above +250) indicates that a trend reversal in the opposite direction is approaching.